Things to do in Kiribati
Kiribati offers a unique blend of cultural and beach-themed activities perfect for tourists. Visitors can enjoy stargazing under clear skies, canoeing in serene waters, and engaging in local basketball games. Key experiences include fishing for golden trevally, birdwatching, scenic boat rides, and exploring vibrant snorkeling spots. With its stunning natural beauty and rich culture, Kiribati promises an unforgettable vacation experience.
Shopping
Near the center of Tarawa, you'll discover the bustling Bikenibeu Market, where local artisans offer vibrant handicrafts and traditional woven items. For a more modern experience, check out the Kiribati Shopping Centre, featuring various shops for unique souvenirs and local goods.
Recreation
Bairiki National Stadium in Kiribati offers an invigorating atmosphere for wellness enthusiasts. Engage in various sports activities, from jogging to team games, while soaking in the vibrant local culture. The stadium's lively ambiance promotes fitness and community connection, making it an ideal spot for recreation and well-being.
Adventure
In Kiribati, explore the pristine beaches of Tarawa, where you can snorkel vibrant coral reefs. Experience the unique culture of the Gilbert Islands through traditional dance and crafts. For thrill-seekers, try kite surfing in the turquoise waters of Betio, offering an exhilarating adventure against a breathtaking backdrop.
Nightlife
The nightlife in Kiribati is laid-back yet vibrant, with local bars like the Tarawa Beach Resort offering refreshing cocktails and live music. For a unique experience, visit the local cultural performances, showcasing traditional dances and songs under the stars.
*Distances are measured in a straight line; actual driving distances may vary depending on the route.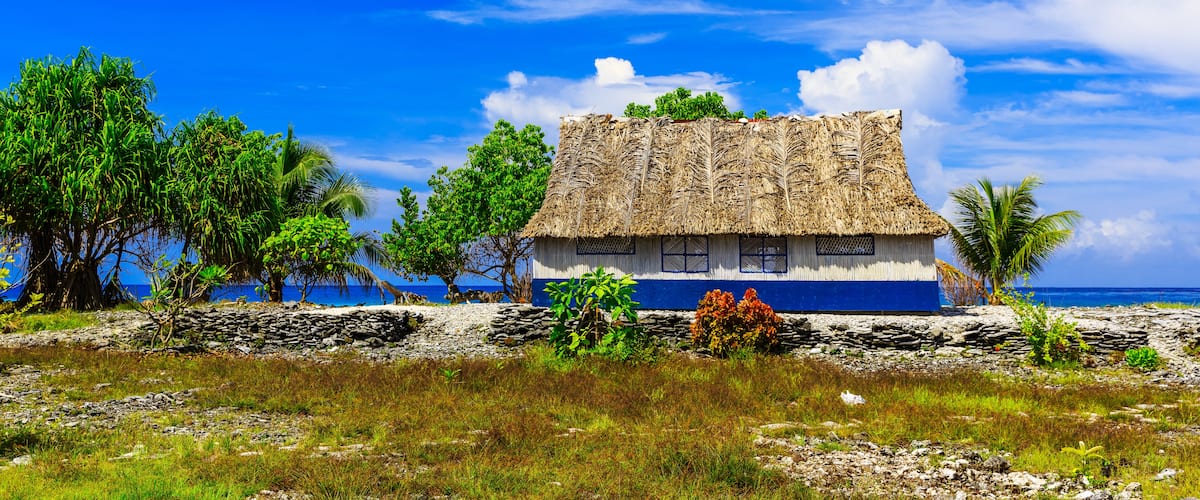


 Calendar Month
 Temperature
 Precipitation
 Cloudiness
 Occupancy
 Pricing